Page:Life Movements in Plants.djvu/221
in the longer limb. Table XIII shows how increasing pressure enhances the rate of growth till a critical point is reached, beyond which there is a depression. This critical point varies in different plants.
TABLE XIII.—EFFECT OF INCREASED INTERNAL HYDROSTATIC PRESSURE (Kysoor).
| Specimen. | Hydrostatic pressure. | Rate of growth. |
No. I … … … … … … … … … … … … … … … … … … … … … … … … … … … … |
Normal … … … … … … … … … … … … … … … … … … … … … … … … … … … … |
0.18 μ per second. |
2 cm. pressure … … … … … … … … … … … … … … … … … … … … … … … … … … … … |
0.20 μ per„ second.„ | |
4 cm. pressure„ … … … … … … … … … … … … … … … … … … … … … … … … … … … … |
0.11 μ per„ second.„ | |
No. II … … … … … … … … … … … … … … … … … … … … … … … … … … … … |
Normal … … … … … … … … … … … … … … … … … … … … … … … … … … … … |
0.13 μ per second. |
1 cm. pressure … … … … … … … … … … … … … … … … … … … … … … … … … … … … |
0.20 μ per„ second.„ | |
3 cm. pressure„ … … … … … … … … … … … … … … … … … … … … … … … … … … … … |
0.18 μ per„ second.„ | |
4 cm. pressure„ … … … … … … … … … … … … … … … … … … … … … … … … … … … … |
0.15 μ per„ second.„ |
RESPONSE TO NEGATIVE VARIATION OF TURGOR.
I shall now describe the influence of induced diminution of turgor on the rate of growth.
Method of plasmolysis: Experiment 72.—Being desirous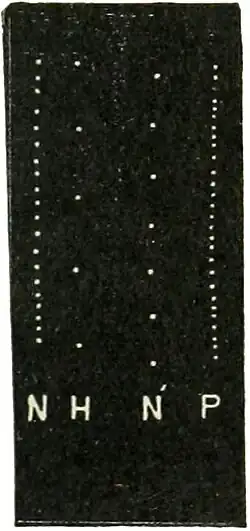 of demonstrating the responsive growth variations of opposite signs in an identical specimen under alternate increase and diminution of turgor, I continued the experiment with the same peduncle of Zephyranthes in which the growth acceleration was induced by irrigation with warm water. In that experiment the growth rate of 0.04 μ per second was enhanced to 0.20 μ per second after irrigation. A strong solution of
KNO3 was now applied at the root;
of demonstrating the responsive growth variations of opposite signs in an identical specimen under alternate increase and diminution of turgor, I continued the experiment with the same peduncle of Zephyranthes in which the growth acceleration was induced by irrigation with warm water. In that experiment the growth rate of 0.04 μ per second was enhanced to 0.20 μ per second after irrigation. A strong solution of
KNO3 was now applied at the root;
Fig. 71.—Effect of alternate increase and diminution of turgor on the same specimen: N, normal rate under drought; H, enhanced rate under irrigation with warm water; N′, normal permanent rate after irrigation; P, diminished rate after plasmolysis (Zephyranthes).