Page:EB1911 - Volume 25.djvu/766
between gusts and squalls is best illustrated by the traces of a Dines pressure-tube anemograph. The trace reproduced in fig. 1 for an ordinary steady wind shows that the force of the wind is constantly oscillating. The general appearance of the trace is a ribbon which has a breadth proportional to the mean wind velocity. The breadth of the ribbon is also dependent upon the nature of the reference; the better the exposure the narrower the ribbon; for an anemograph at a coast station the ribbon is wider for a shore wind than for a sea wind.
From the records obtained at Scilly and Holyhead, Dr G. C. Simpson concluded that a wind of mean hourly velocity v was composed of alternations of gusts and lulls ranging on the average between limits ·5 +1·2v and —·5+76v with occasional recurrences to extreme velocities of 1·5+1·3v and -1·0+·65v. In other words, the average range of the ribbon is ·5+·45v for the two stations during the hour when the mean velocity is v, and the extreme range within the same period is 2·0+·68v.
The differences of gust velocity at stations with different exposures may be illustrated by quoting the breadth of the ribbon for a 30 m. wind at the following stations:—
| Southport (Marshside) | 10 m. | |
| Scilly | 15 m.„ | |
| Shoeburyness | 20 m.„ | (from W.) |
| Shoeburyness„ | 10 m.„ | (from E.N.E.) |
| Holyhead | 15 m.„ | |
| Pendennis Castle (Falmouth) | 8 m.„ | (from S.) |
| Pendennis„ Castle„ (Falmouth)„ | 16 m.„ | (from W.) |
| Aberdeen | 30 m.„ | (from N.W.) |
| Alnwick Castle | 25 m.„ | |
| Kew | 30 m.„ |
Fig. 2 represents a succession of squalls occurring in an ordinary gusty wind; the squalls succeed one another with fair regularity about every twenty minutes and last in full force for a few minutes. A

Fig. 1.
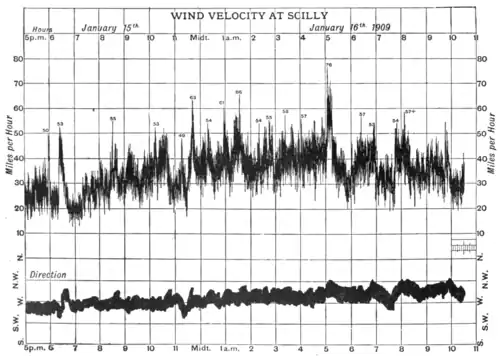
Fig. 2.